Cloudflare Dashboard for Grafana: Because Monitoring Shouldn’t Cost More Than Your First Server
Have you tried turning your metrics off and on again? No need - we’re about to set up a monitoring system that’s more reliable than Jen’s understanding of “The Internet”!
The Problem with Enterprise Monitoring (Or: Why I Can’t Afford Another Black Box)
You know what’s really frustrating? When you want to monitor your Cloudflare metrics but the enterprise license costs more than that time Roy accidentally bought a hundred mechanical keyboards thinking they were on sale (they weren’t). But fear not, fellow monitoring enthusiasts! We’re about to set up a dashboard that’s more impressive than Moss’s collection of vintage calculators, and it won’t cost you a single penny from the Reynholm Industries budget.
The Solution: Infinity Datasource (It’s Not Actually Infinite, Jen)
We’re going to use two magical components (and no, Jen, they’re not actually magical - they’re just very clever pieces of software):
- Infinity Datasource - It’s like having a tiny Douglas Denholm inside Grafana, fetching all your Cloudflare metrics
- A pre-built dashboard (ID: 22568) - Because writing dashboards from scratch is like trying to explain to Jen what RAM does
Setting Up Our Monitoring Paradise (No Fire Extinguisher Required)
First, let’s install the Infinity plugin. Don’t worry, it’s easier than explaining to Moss why he can’t download more RAM:
Navigate to “Connections” -> “Add New Connection” (Yes, it’s that simple. No, you don’t need to climb into the server room)
Get your Cloudflare API key (It’s like getting an access card to the 7th floor, but digital):
- Follow the guide (it’s written in English, not Binary)
- For permissions, select:
- Zone (not to be confused with the Twilight Zone)
- Analytics (because numbers are cool)
- Read access (we’re observers, like that time Roy spent a whole day watching the blinking server lights)
Configure Authentication:
Step 1: Choose "Bearer Token"
Step 2: Paste your token
Step 3: That's it! (I know, I was surprised too)
Set up Security (More secure than Roy’s password “password123”):
- Under “Security” -> “Allowed Hosts”, add these URLs:
https://api.cloudflare.com/client/v4/graphql
https://api.cloudflare.com/client/v4/user/tokens/verify
(Copy-paste these exactly - they’re more sensitive than Moss’s keyboard cleaning routine)
- Under “Security” -> “Allowed Hosts”, add these URLs:
(Optional) Enable Healthcheck:
- Because monitoring your monitoring system is like having a mirror to look at your mirror
- URL: https://api.cloudflare.com/client/v4/user/tokens/verify
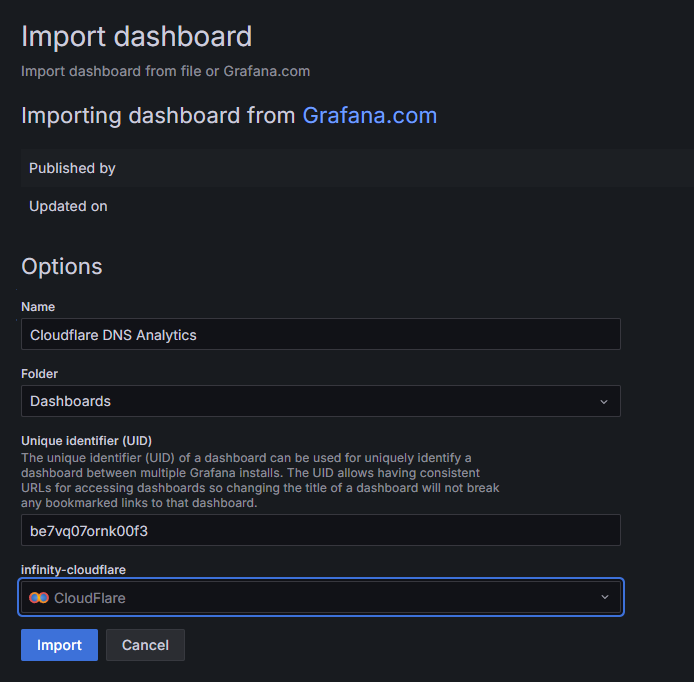
Importing the Dashboard (It’s Like Installing Adobe Reader, But Actually Useful)
Now for the exciting part - getting that dashboard up and running:
Import dashboard ID: 22568 (Remember this number - it’s more important than the IT emergency number: 0118 999 881 999 119 725… 3)
Select your Infinity datasource (The one we just set up, not the one from that parallel universe where everything works on the first try)
Finding Your Zone ID (The Quest for the Sacred Number)
Every dashboard needs a zone ID, like every computer needs a fan (right, Moss?). Here’s how to find yours:
- Log into Cloudflare (I assume you remember your password, unlike Roy)
- Find your domain (the one you’re actually monitoring, not your fan site about “The IT Crowd”)
- Look for the API section on the Overview page (it’s right there, where you’d expect it - shocking, I know)
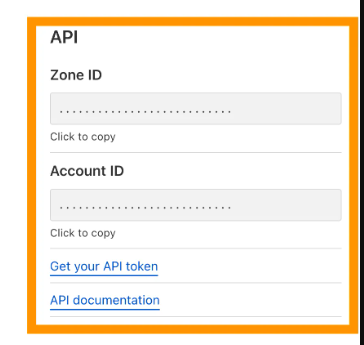
Once you’ve got your Zone ID, pop it into the dashboard’s text box. It’s like typing your password, but you’re actually allowed to share this one!
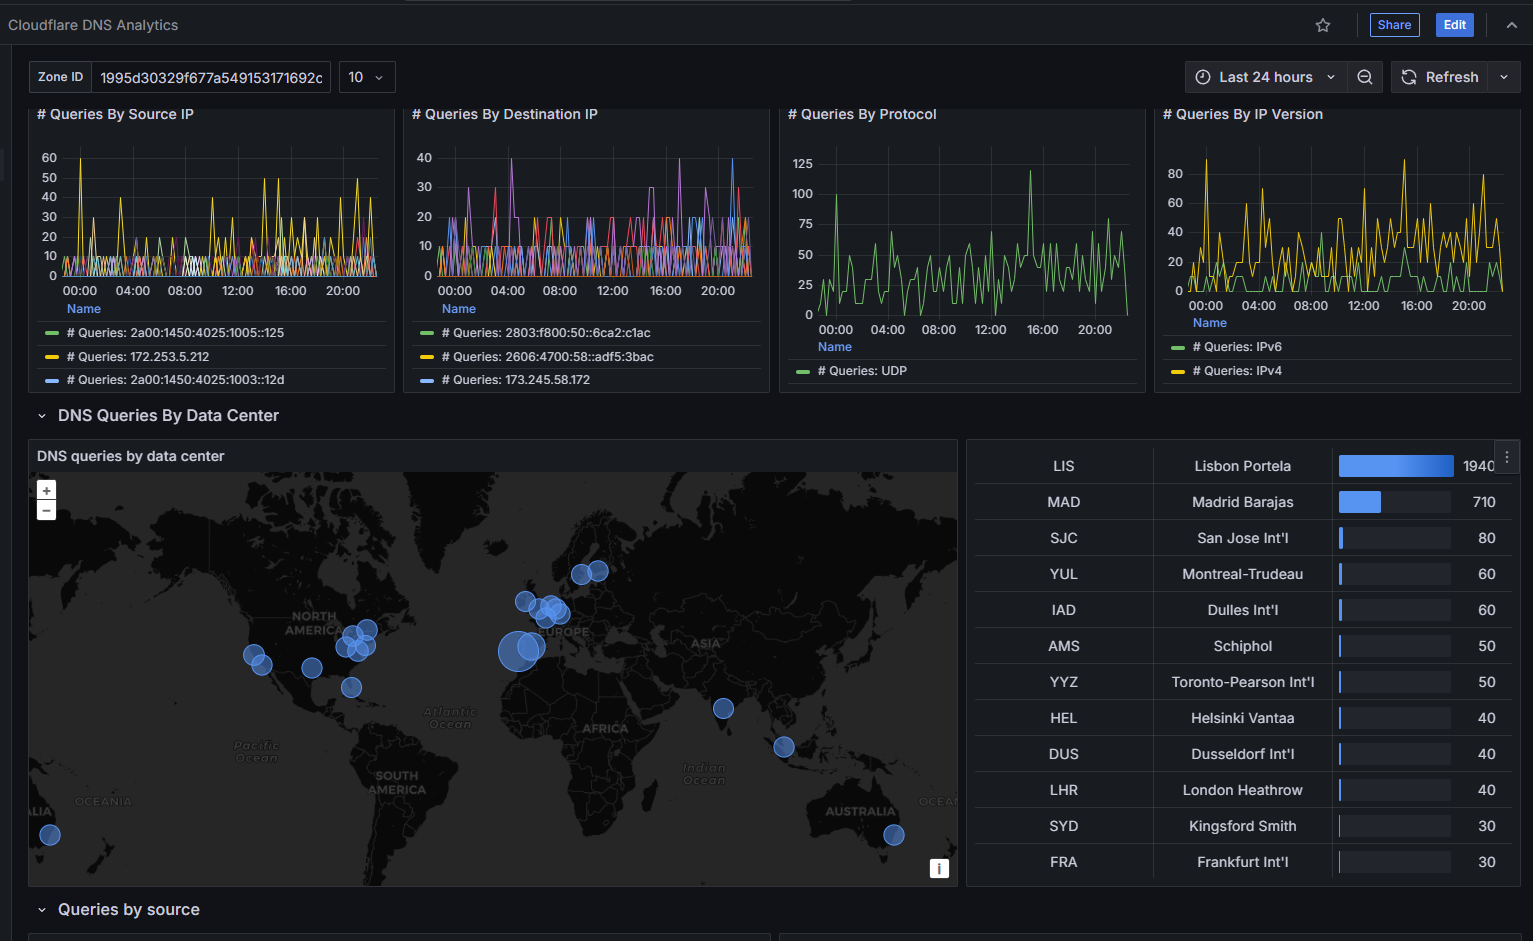
Conclusion
And there you have it! A fully functional Cloudflare monitoring dashboard that’s more reliable than the time Jen tried to present the Internet to the board. Your metrics are now as visible as Roy’s attempts to avoid work, and twice as informative!
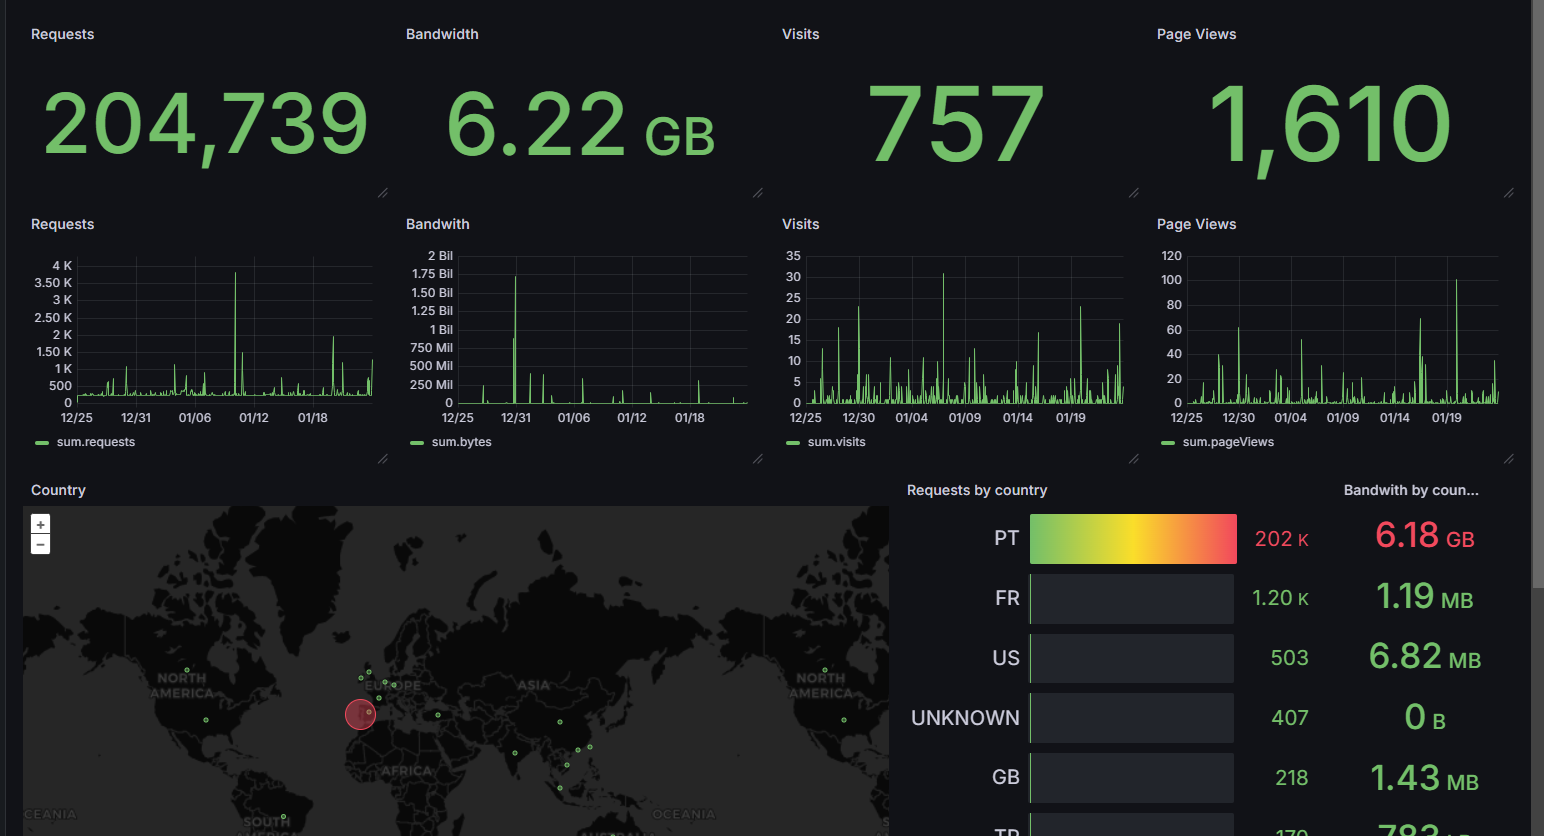
If you need Zone Analytics, you can use a diffrent dashboard ID: 21368 and use the same source when importing the dashboard. Dont forget to change the Zone ID in the dashboard, this one calls it ZoneTag
Remember: The best monitoring system is like Richmond - always there when you need it, even if you forget it exists sometimes.
References
- Cloudflare API Documentation (More readable than Moss’s binary bedtime stories)
- Grafana Infinity Datasource (No relation to the infinity of Roy’s support tickets)
- Dashboard 22568 (Pre-built, like Jen’s understanding of computers)
- Dashboard 21368 (For Zone Analytics)